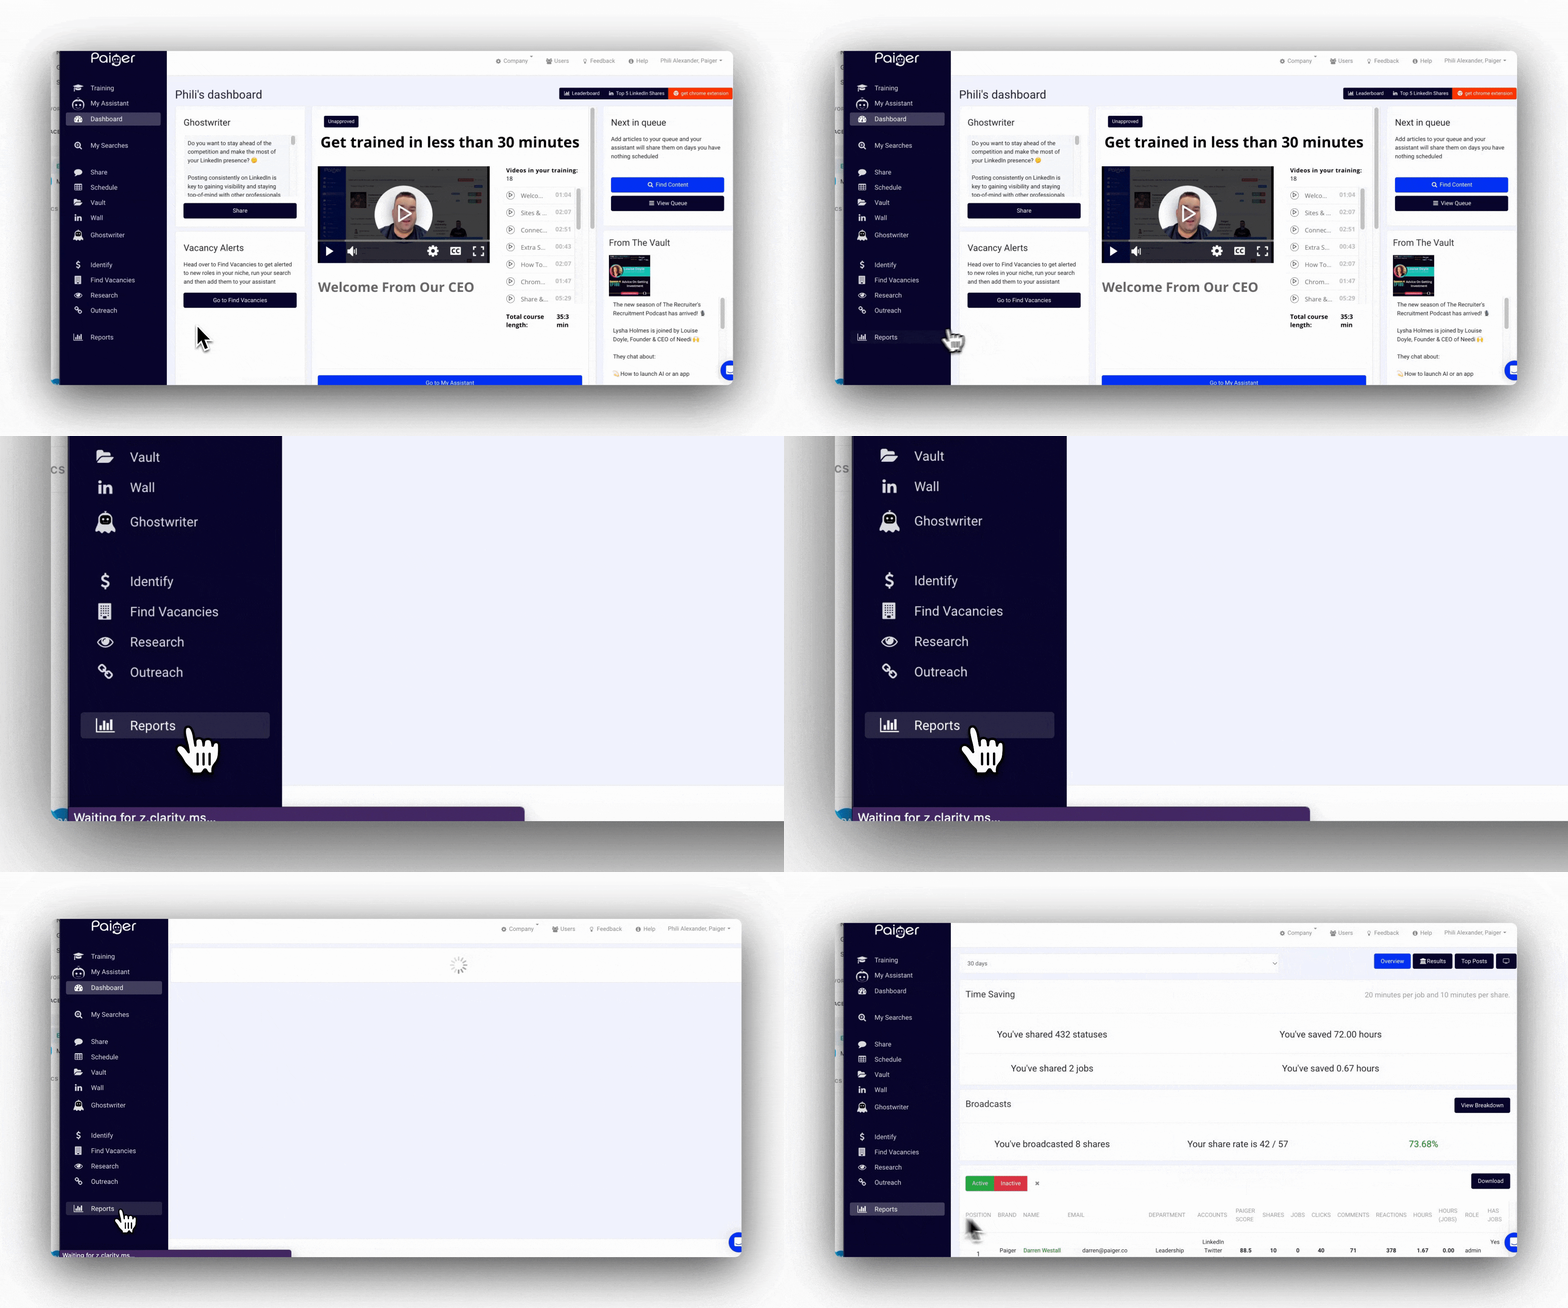
How to use reports
Report on likes, clicks and comments so you can showcase the impact of marketing.
To access, click on 'Reports'

Top tip - You can have full control of your reporting by filtering by the last 7 days, 14 days, 30 days, 60 days or 90 days. Just select the drop-down at the top of the page.
Monitor time saved
The initial report you will find is 'Time Saving'.
In this report, you can keep track of the number of statuses that have been shared among all your users. Paiger calculates the estimated amount of time saved compared to if the same number of statuses were shared without using Paiger's tools.
Additionally, you can monitor the number of jobs that have been shared among your users, and Paiger calculates the hours saved based on this information.
This calculation is based on the assumption that a user spends 20 minutes per job post and 10 minutes per share, whereas using Paiger reduces this time to seconds.

Keep track of your broadcasts
The next report helps to keep track of how your broadcasts perform.
You can see the number of broadcasts, how many have been shared, and the % share rate.
To view more in-depth reporting for broadcasts, select 'breakdown'. Here you will see the results for each broadcast.
To see who has shared your broadcast, you can hover your mouse over each category to see the names. Or, you can click on the broadcast to see more details.

The Paiger Leaderboard
Create a sense of competition between users with the Paiger Leaderboard.
Here you can see your top performers and easily spot users that need a helping hand. Active users are highlighted green and inactive are red - easily filter between the two.
Keep track of each user's 'Paiger Score'. This is calculated from your number of Shares, Jobs, Clicks, Comments and Reactions.
We use the following formula to calculate the Paiger Score: =SUM((Shares*0.25)+(Jobs*0.1)+(Clicks*0.2)+(Comments*0.3)+(Reactions*0.15))
Monitor performance with analytics for their posts shared, see number of shares and their clicks, comments, reactions and total time saved.
Download the report by clicking the 'download' button, which will export it into a CSV.
The Leaderboard automatically updates every 24 hours after the last person accessed it. Please note that it does not update in real-time.
The extra bits
- Track Paiger University results by clicking on the '🏫 results' button.
- See your users top performing posts
- Display your leaderboard in the office on a screen or TV by clicking on the '🖥️' button. This brings up a web page that scrolls through the leaderboard.
